Understanding Independence and Why it is Critical in Causal Inference and Causal Validation

Background
In a recent article the author explored and explained how the concept of dependence can be used to validate a proposed Directed Acyclic Graph (DAG) against a dataset to identify spurious edges in the graph i.e. causal links suggested by the DAG that do not exist in the data.
In this second instalment, the opposite (but equally critical) concept will be applied i.e. how to use independence to identify missing edges. These are causal links that do not appear in the proposed DAG but do actually exist in the data that must be added back into the DAG to make it complete and correct.
Introduction
Causal Inference is an emergent branch of data science concerned with determining the cause-and-effect relationship between events and outcomes and it has the potential to significantly add to the value that machine learning can generate for organisations.
For example a traditional machine learning algorithm can predict which loan customers are likely to default thereby enabling proactive intervention with customers. However, although this algorithm will be useful to reduce loan defaults it will have no concept of why they occurred and whilst pro-active intervention is useful, knowing the reasons for defaults would enable the underlying cause to be addressed. In this world pro-active intervention may no longer be necessary because the factors that led to defaulting have been permanently cured.
This is the promise of Causal Inference and why it has the potential to deliver significant impact and outcomes to those organisations that can harness that potential.
There are a number of different approaches but the most common approach typically starts by augmenting the data with a "Directed Acyclic Graph" (DAG) which encapsulates and visualises the causal relationships in the data and then uses causal inference techniques to ask "what-if" type questions.
The Problem
A DAG that encapsulates the causal relationships in the data is typically constructed manually (or semi-manually) by data scientists and domain experts working together. Hence the DAG could be wrong which would invalidate any causal calculations leading to flawed conclusions and potentially incorrect decisions.
The Opportunity
A range of techniques exist for "Causal Validation" (the process of validating the DAG against the data) and if these techniques work they can minimise or eliminate errors in the DAG thereby ensuring that the calculations and conclusions are error-free.
The Way Forward
The statistical concept of independence between random variables can be used to ascertain whether a relationship that does not exist in the DAG does exist in the data. If this situation is encountered it is likely that the causal relationship that is missing in the DAG needs to be added to it to make it complete and correct.
Getting Started
We are going to need an example DAG to work through the problem which has enough nodes and links to provide a good example with which to explore the problem …
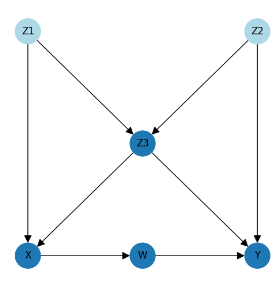
The DAG is entirely fictitious so the letters on the nodes do not have any meaning, but to note that "X" is the treatment, "Y" is the outcome and the other nodes represent factors that are affecting the outcome with the potential to hide or skew the true effect of X on Y.
To better understand the DAG, if this were a real-world problem it could represent the following …
- X represents the regularity with which a drug is taken.
- W represents the effect of the drug on blood pressure.
- Y represents the improvement on patient recovery and outcome.
- Z1, Z2, and Z3 represent other factors (for example maybe Z1 represents healthy lifestyle and Z3 represents fitness level etc.)
The arrows in a DAG then represent the causal effect of one factor on another, for example …
- Taking the drug (represented by "X") has a causal effect on blood pressure (represented by "W") which in turn has a causal effect on patient recovery ("Y").
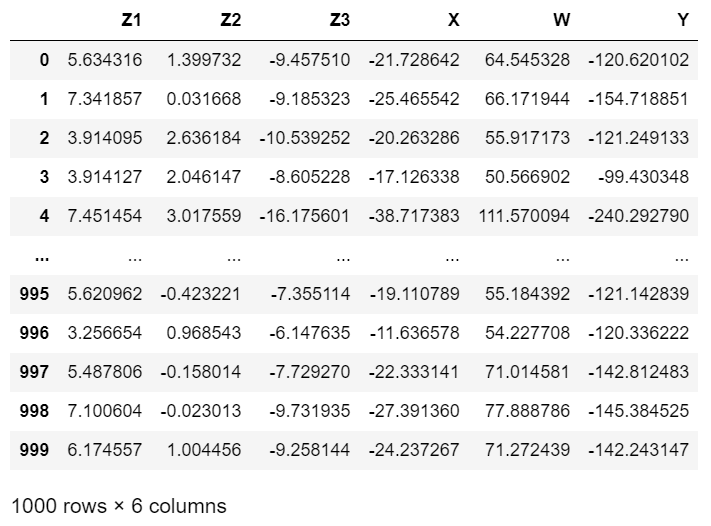
We will also need some data that matches the DAG. The dataset below is entirely synthetic and has been generated by the author; it exactly encapsulates and matches the structure suggested by the DAG and contains no erroneous or faulty relationships …
The next sections will begin to unpack the DAG and the data and use them to explain how statistical independence can be used to identify causal links that have been missed or omitted from the DAG.
Understanding Independence
One definition of independence is as follows –
"Independence between two random variables refers to a fundamental concept where the occurrence or value of one random variable does not influence or provide any information about the occurrence or value of the other random variable".
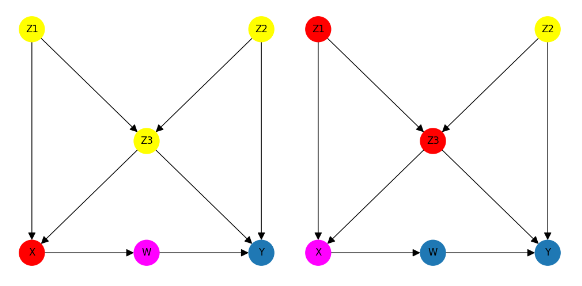
Let's take another look at our DAG and consider nodes Z1 and Z2 …
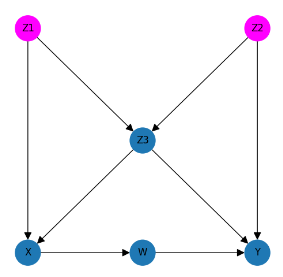
We can see that nodes Z1 and Z2 (representing some causal factors affecting the treatment and outcome) have no direct or indirect connection and their are no paths through the DAG that link them so Z1 can be said to be independent of Z2 (and vice versa).
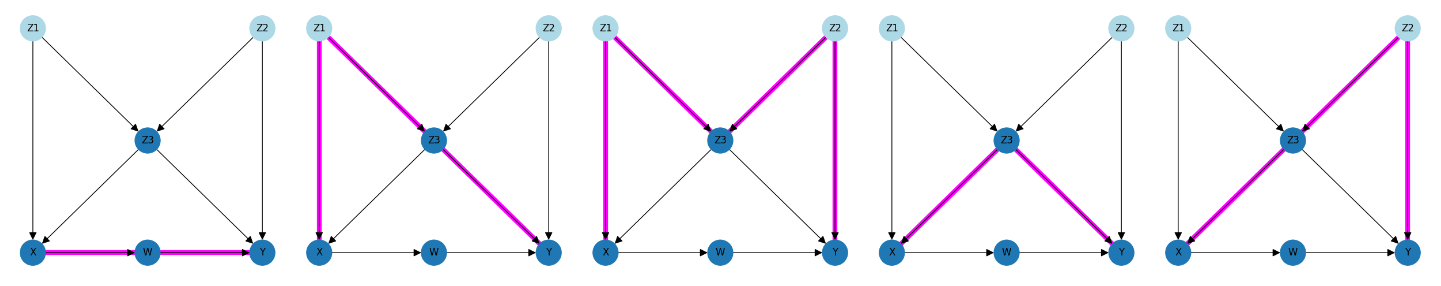
To illustrate the point further we can also see that although X (the treatment) and Y (the outcome) are not directly connected they are in fact dependent because there are several paths through the DAG that connect them …
What these two examples show is that if the value if Z1 changes it will not influence or change the value of Z2 but if the value of X changes it will change the value of Y.
This explanation can be expanded by taking another look at the dataset that the DAG is modelling …
In a real-world causal inference problem the data would be the starting point and the DAG would be developed by consulting with the domain experts but to facilitate the article the author needed a dataset that was guaranteed to match the DAG.
Hence the dataset above was generated by applying the following formulae to create 1000 rows of data …
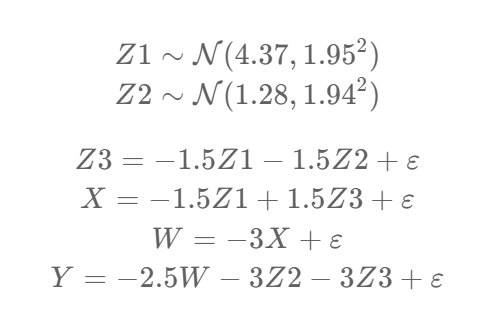
This can be read and understood as follows –
- Z1 is an exogenous variable (i.e. it has no inputs) that is normally distributed with a mean of 4.37 and a standard deviation of 1.95
- Z1 is an exogenous variable that is normally distributed with a mean of 1.28 and a standard deviation of 1.94
- Z3 = -1.5 X Z1–1.5 x Z2 + an error term
- X = -1.5 x Z1 + 1.5 x Z3 + an error term
- W = -3 x XZ + an error term
- Y = -2.5 x W + -3 x Z2 + -3 x Z3 + an error term
The formulae that were used to create the data clearly show that Z1 is independent of Z2 because they are both completely separate normal distributions but that X and Y are not independent because changing X will change W and changing W will change Y.
There is yet another way of representing this, by using mathematical notation to show the dependence …

The ⫫ symbol is called a "double up-tack" and means "is independent of". The ⫫̸ symbol does not have a widely accepted name so I have adopted "slashed double up-tack" through personal preference and means "is dependent on" so the formulae above read as "Z1 is independent of Z2" and separately "Y is dependent on X".
In concluding this section we will bring this knowledge back to its importance in the context of causal validation.
In a causal inference problem the data will have been collected and the DAG will have been constructed separately, usually by consulting domain experts who could potentially have made mistakes or whose knowledge could have been incomplete.
Causal validation then is the process of proving or disproving that the DAG is a valid causal representation of the data.
Independence has a critical role to play in this process because if the dependencies and independencies represented in the DAG can all be matched and detected in the data then it can be inferred that the DAG is valid.
This can be represented using the following formulae ..
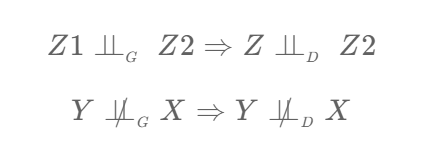
These formulae look scary but are actually very straightforward.
The first says that if Z1 is independent of Z2 in the graph (DAG) then Z1 should also be independent of Z2 in the data.
The second says that if Y is dependent on X in the graph (DAG) then Y should also be dependent on Y in the data.
Using Independence to Identify Missing Causal Links
In a previous article I explained how independence can be used to detect spurious links i.e. causal relationships that appear in the DAG that do not appear in the data …
Demystifying Dependence and Why it is Important in Causal Inference and Causal Validation
… and in the remainder of this article I will explore how dependence can be used to identify missing links i.e. causal relationships that do not appear in the DAG that do appear in the data.
It follows that if missing links can be identified using independence they can then be added back into an invalid DAG to make it valid.
The approach proposed in this article has its basis in the many works and published papers of Judea Pearl who is recognised as a global authority on causal inference.
In "Causal Inference in Statistics" (Pearl, Glymour, Jewell, 2019) Pearl explores the idea of using d-separation to identify missing links but it is a partial example and does not provide enough explanation to implement an algorithm in Python.
Note: the link above is an amazon affiliate link. If you use the link to purchase the book a small finders fee will be paid to the author of this article at no additional cost to the purchaser.
The exploration below aims to provide sufficient explanation and examples such that a solution can be implemented in Python that will reliably identify causal links that are missing from the DAG but that exist in the data.
This is the rule which must be implemented to reach that goal …
"Within a DAG any node N should be independent of its non-descendants given its parents"
(authors own words)
That sounds complicated and it is difficult to understand in isolation but with examples it can be made clearer.
Every node in the DAG can be tested separately against that rule. Here is the rule applied to node "W" …

… which can be read as – "W is independent of its non-descendants given (when conditioned on) its parents".
So what does this mean and how can it be applied to identify missing causal relationships in the DAG?
To start with we will need to fully understand what is meant by "parents" and what is meant by "non-descendants".
To note: the following diagrams are coloured-coded as follows …
- Pink: The node of interest
- Red: Parents
- Green: Descendants
- Yellow: Non-descendants
- Blue: All other nodes
The parents of a node are easy to visualise; they are the nodes in the DAG that have a causal link with an arrow pointing into that node and we can visualise that by considering the charts representing the parents of node W and separately the parents of node X …
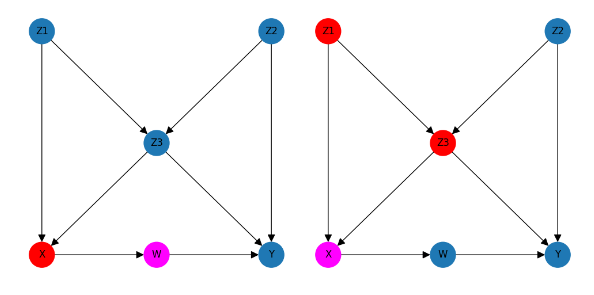
We can see that node W has a single parent – X and node X has two parents – Z1 and Z3 and we can also see that different nodes can have zero, 1 or more parents.
Non-descendants are slightly harder to visualise as they are subtly different from ancestors. My definition of non-descendants of a node is as follows …
"Non-descendants of a node are all nodes that are not descendants and also not direct parents"
To illustrate this, let's first visualise all of the descendants of node W, and separately node X …
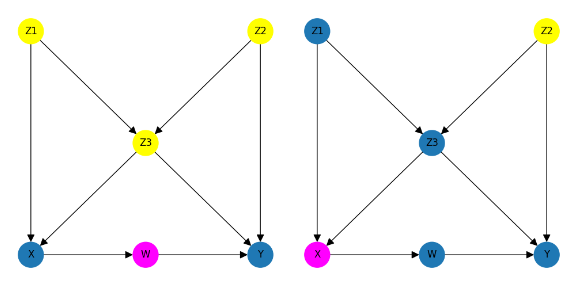
And finally, here it is all together – a diagram for node W and a separate diagram for node X that highlights their parents in red and their non-descendants in yellow …
You may be wondering two things at this point …
Why do non-descendants exclude direct parents?
The answer to this question that this is a definition of "non-descendants" that broadly follows the solutions proposed in the books of Judea Pearl to discover missing links and if you include parents then the following formula will not work …
… because the parents would appear on both sides if the "given" symbol (|).
What does all this have to do with causal validation?
The answer to this question will be revealed in the next section …
Using Independence, Non-Descendants and Parents to Identify Missing Links in the DAG
So far we have defined what independence is i.e. if A is independent of B then changing the value of A has no effect on B. We have also explored and understood what is meant by "parents" and "non-descendants" and we have a formula inferred and consolidated from the literature that can identify missing links (
