The terms ‘confidence interval‘ and ‘_prediction interval_' are frequently thrown around interchangebly inside Data Science meetings. I must confess that I've done it myself sometimes, just to appear smart.
However, this is dangerous. Confidence and prediction intervals refer to very different things and you risk potentially being caught off guard by someone who understands the difference. That would definitely be embarrassing.
But don't despair! In this article, I will intuitively explain the difference between the two intervals and make you feel confident in applying them.
Confidence Interval
Overview
The more well-known one is the confidence interval, so let's start here. A confidence interval is a measure of uncertainty on some sampled parameters such as the mean from a sample or a coefficient in a regression model. It helps us understand the proximity of our estimate to the true population value. If you're interested in learning more about confidence intervals, feel free to check out my previous blog post on the topic:
The goal of linear regression is to determine the unknown coefficients β₀ and β₁ based on some data, represented by the variables x and corresponding outputs or response y. However, in practice, we often only have access to a random sample from the entire population. Consequently, the values of β₀ and β₁ are subject to uncertainty since they are estimated from this random sample and not the population. This uncertainty is the source of ‘error' in regression models.
In the case of a confidence interval, it represents the level of uncertainty associated with the estimated mean response, E[y | x]. Let's consider an example of a dataset comparing salary and age, where we find that the mean salary for a 23-year-old is £28,000, E[salary | 23] = £28,000. If we calculate a 95% confidence interval and obtain a range of £26,000 to £30,000, it suggests that we can expect the true mean salary for the entire population of 23-year-olds to fall within this interval with a probability of 95%. Although this explanation may not capture all the intricacies, it serves the purpose of providing a general intuition.
See here for a rigorous definition of the confidence interval and its implications.
To put it in one sentence:
Confidence Interval = Uncertainty In The Mean Response
Formula
The formula for the confidence interval in regression is quite lengthy, but luckily most statistical software perform it for us! However, for completeness, let's state the formula and highlight some key features:
Equation by author in LaTeX.Equation by author in LaTeX.
Where:
x: The feature or covariate value
ŷ: The prediction for x****
t_(1-α/2, n-2) = _T-distribution critical value for a confidence level of 1-α ** with n-2 degrees of freedo**_m
Again, don't get too bogged down in this mathematical details – I certainly haven't! The purpose was simply to provide a little insight into the origin of the formula. As you can see, its mainly unifying the spread of the data and the error in the prediction. If you're interested in a comprehensive derivation, checkout this link here.
Prediction Interval
Overview
The confidence interval measures the uncertainty in estimating the mean response, so what does the prediction interval do? The prediction interval measures the uncertainty of where a new sampled value is likely to fall. It achieves this by considering all the observed responses in the current sample. It takes into account both the variability in our sample and the uncertainty of the estimated regression model.
Theory
Remember our simple linear regression equation above:
Equation by author in LaTeX.
The confidence interval express the sampling uncertainty in E[y | x], whereas the prediction interval express the uncertainty in the range of y. As it is considering the whole range and not just the mean, the prediction is naturally larger than the confidence interval.
The confidence interval expresses the sampling uncertainty associated with estimating E[y | x], the expected value of y on x. Whereas, the prediction interval captures the uncertainty in the whole range of possible values of y. Since the prediction interval considers the entire range and not just the mean, it is naturally wider than the confidence interval.
Formula
The formula for the prediction interval is closely related to that of the confidence interval:
However, do you observe the one key difference? That's right, there is an additional term involving the MSE. By introducing this extra positive term, we can see mathematically that the prediction interval will be larger than the confidence interval.
Example Plot
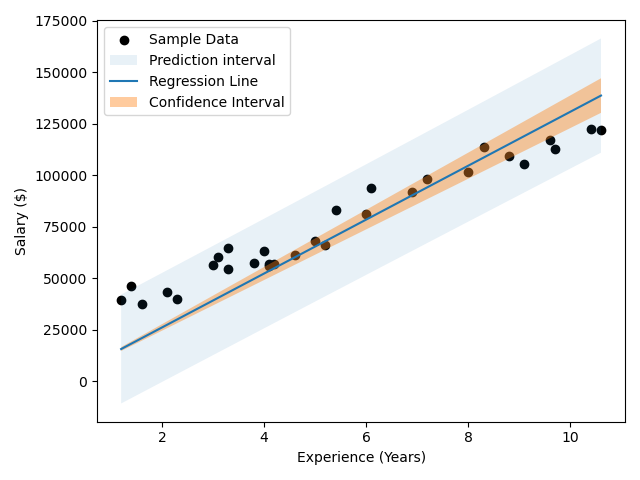
To better understand confidence and prediction intervals, let's walk through an example that visualises them. Below is a code snippet that generates a plot displaying the relationship between salary and experience. The plot includes the data points, the regression line, and the 95% confidence and prediction intervals:
I have a free newsletter, Dishing the Data, where I share weekly tips and advice as a practising data scientist. Plus, when you subscribe, you will get my FREE data science resume and short PDF version of my AI roadmap!